New on QTR: Sectionals, and who's really finishing fast
Every runner's last 600m, last 200m and overall time measured against par for the track, distance and going, rated Elite to Weak. Here's how it works, and four spring Group races where the fastest last-start finisher won.
Two horses run 34.0 seconds for their last 600m. One did it on a heavy track at Sandown in a Group race. The other did it on a firm track at a country meeting where the whole field sprinted home. Same number, very different runs.
That's the problem with raw sectional times, and it's why I've built Sectionals into every race page on QTR. Each runner's recent sectionals are measured against par for that track, distance and going, so you can see straight away who has been finishing genuinely fast.
What you see on the race page
Open any race and go to the new Sectionals tab. For every runner you get their last three runs from the past 18 months:
| Figure | What it tells you |
|---|---|
| L600 v par | Their last 600m against the typical winning L600 for that track, distance and going. Minus is faster. |
| L200 v par | The same for the final 200m. Who was still going at the line, and who was hanging on. |
| Time v par | Their overall time against par, adjusted for the class of the race and the rail position. |
| L600 v race | Their last 600m against the rest of that field. A fast closer in a slowly run race shows up here. |
| Pace and pattern | Whether the race was run fast or slow early, and whether that meeting suited leaders or backmarkers. |
Every figure gets a rating, so you don't need to know what a good number looks like:
| Rating | Where it sits |
|---|---|
| Elite | Fastest 5% of runs |
| Strong | Top 20% |
| Above average | Top 40% |
| Average | The middle |
| Below average | Bottom 40% |
| Weak | Slowest 20% |
Hover over (or tap) any figure to see what it means and how it rates. At the top of the tab, two cards pick out the fastest L600 last start and the fastest time last start in the field.
Does fast last start mean anything?
I checked every Australian race since January 2025 where I had sectionals for most of the field. That's more than 12,000 races.
The runner with the fastest last-start L600 in the field won 15% of the time and ran in the first three 40% of the time. A typical runner in those same races won about 11.5%. The runner with the fastest overall time v par last start won 16%.
Split by rating, the pattern is just as clear:
| Last-start L600 rating | Won next start | Ran top 3 |
|---|---|---|
| Elite | 15.5% | 40.8% |
| Strong | 13.7% | 38.5% |
| Above average | 12.3% | 35.3% |
| Average | 11.0% | 33.0% |
| Below average | 9.3% | 29.5% |
| Weak | 8.0% | 25.8% |
Horses that finished Elite last start won nearly twice as often as horses that finished Weak.
It isn't magic. The market knows a fast finisher when it sees one, and most of these horses are well fancied. What Sectionals gives you is the reason a horse is fancied, or a reason to doubt one that isn't. A horse dropping back in trip, a closer who got stuck behind a slow pace, a leader who kept finding on a day that suited backmarkers. That's where the tab earns its keep.
New to QTR? Sign up free and get 7 days of full access: my ratings, speed maps and race summaries for every race. No card needed.
Sign up freeReal races from the spring
Here are four recent Group races where the fastest last-start sectional in the field went on to win. Each table shows the five fastest L600s last start, then how they finished.
Ndola, Flemington, Derby Day (Group 3, 1200m)
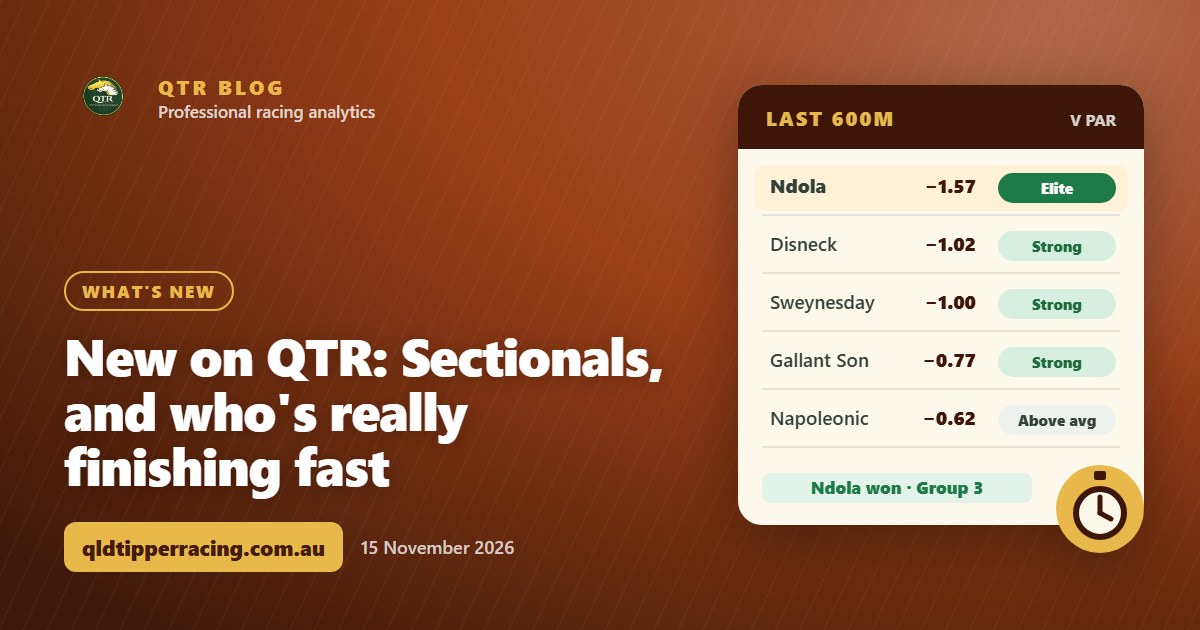
A 19-horse sprint. Ndola came off a provincial win at Cranbourne three weeks earlier, so it was easy to overlook. Its last 600m that day was more than half a second clear of anything else in this field.
| Horse | Last start | L600 v par | L600 rating | Result |
|---|---|---|---|---|
| Ndola | Cranbourne 1200m, won | −1.57s | Elite | 1st |
| Disneck | Randwick 1200m, 6th | −1.02s | Strong | 6th |
| Sweynesday | Caulfield 1000m, 5th | −1.00s | Strong | 2nd |
| Gallant Son | Caulfield 1000m, 4th | −0.77s | Strong | 19th |
| Napoleonic | Caulfield 1200m, 6th | −0.62s | Above average | 16th |
The quinella came from the top three on this list.
Tempted, Randwick, Sat 3 Oct (Group 2, 1200m)
Tempted won over 1000m at Randwick in September and came home like a Group horse. It was Elite on both L600 and overall time, the only runner in the field to do that.
| Horse | Last start | L600 v par | Time v par rating | Result |
|---|---|---|---|---|
| Tempted | Randwick 1000m, won | −1.91s | Elite | 1st |
| King Of Roseau | Flemington 1200m, 7th | −1.31s | Strong | 7th |
| King's Secret | Randwick 1100m, 3rd | −1.19s | Strong | 6th |
| Plaintiff | Rosehill 1200m, 4th | −1.10s | Strong | 9th |
| Grafterburners | Randwick 1100m, 8th | −1.06s | Above average | 4th |
Flying For Fun, Flemington, Derby Day (Group 3, 1100m)
Second at Caulfield three weeks earlier, beaten but finishing faster than anything else in this field. It topped both the L600 card and the time card before the race.
| Horse | Last start | L600 v par | L600 rating | Result |
|---|---|---|---|---|
| Flying For Fun | Caulfield 1100m, 2nd | −1.08s | Strong | 1st |
| Inkaruna | Caulfield 1100m, 3rd | −0.78s | Strong | 4th |
| Naifah | Caulfield 1200m, 2nd | −0.29s | Above average | 11th |
| Swift Force | Caulfield 1100m, 2nd | −0.27s | Above average | 3rd |
| Photograph | Caulfield 1100m, 3rd | −0.26s | Above average | 5th |
The Next Episode, Flemington, Derby Day (Group 1, 1200m)
This one shows why the tab has more than one number. The Next Episode's overall time last start was only below average, because that whole race was run in a slow time. The other runners from it rate just as poorly on time. Its last 600m was still the best in a Group 1 field, and it won.
| Horse | Last start | L600 v par | Time v par rating | Result |
|---|---|---|---|---|
| The Next Episode | Flemington 1100m, won | −0.42s | Below average | 1st |
| Satono Glow | Rosehill 1200m, won | −0.34s | Strong | 13th |
| Mbube | Flemington 1100m, 3rd | −0.11s | Below average | 3rd |
| Steel Will | Rosehill 1200m, 2nd | −0.06s | Above average | 8th |
| The Machine Gun | Rosehill 1200m, 6th | −0.04s | Average | 7th |
Not every race works out this neatly, and plenty of fast finishers get beaten. But when you're down to two or three, knowing which one has actually been running home is a big help.
Where it comes from
Sectionals cover metro and provincial racing across the major states, going back to late 2023, and update overnight after each meeting. Pars are built from every race I have at each track, split by distance and going, so a heavy-track run at Sandown is compared with other heavy-track runs at Sandown, not with a firm day at Flemington.
How to get it
Sectionals is part of QTR Elites. During my launch special, every member and every free trial gets it, along with everything else on the site.
If you're not a member yet, you can start a free 7-day trial and open the Sectionals tab on this weekend's races. See everything that's included on the Unlock QTR page.
Fast finishers or not, set yourself a budget first and stick to it.
18+ | Gamble responsibly | Gambling Help 1800 858 858 | gamblinghelponline.org.au | BetStop
Frequently asked questions
What are sectionals?
Sectional times are how fast a horse ran each part of a race. On QTR the key ones are the last 600m and last 200m, measured against par for that track, distance and going so runs at different tracks can be compared.
What does minus mean on L600 v par?
Minus is faster than par. A horse at -1.00s ran its last 600m a full second quicker than a typical winner over that track, distance and going.
Where do I find Sectionals?
Open any race from Meetings and choose the Sectionals tab. Each runner's last three runs from the past 18 months are shown, with a rating on every figure.
Who can see Sectionals?
Sectionals is part of QTR Elites. During the launch special every member and every free trial can use it.
Get 7 days of full access, free
Sign up free and every feature is unlocked for your first 7 days. No card needed.
- My ratings, speed maps and race summaries for every race
- Ratings Lab, My Assessment and custom speed maps
- QTR Futures for the big races ahead
- Form tools, head to head, trainer patterns and the Statistics tab
Read next
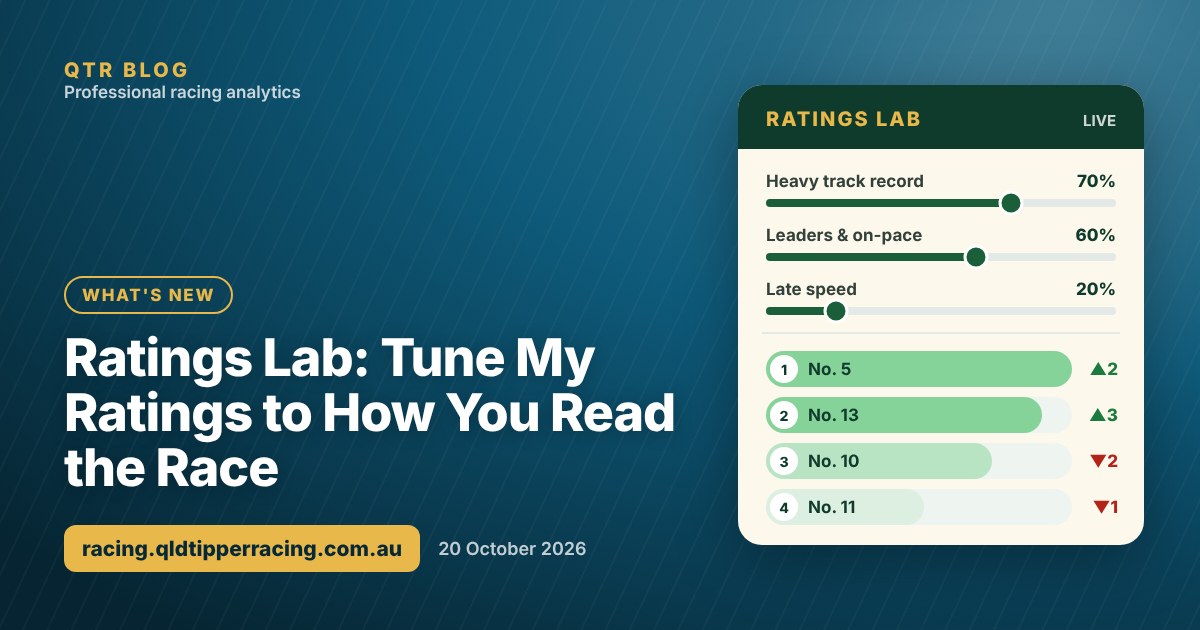 What's newRatings Lab: Tune My Ratings to How You Read the RaceHeavy track and the leaders holding on? Ratings Lab lets you tune my ratings to how you think a race will be run, and watch the field re-order as you go.
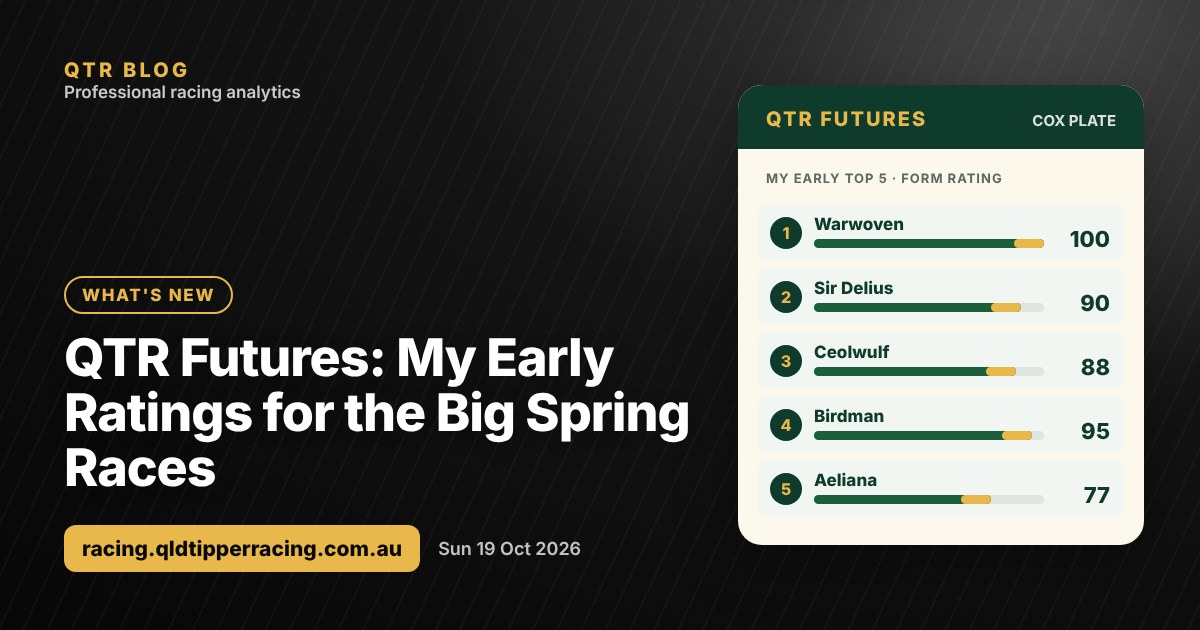 What's newQTR Futures: My Early Ratings for the Cox Plate and the Big Spring RacesMy early rating for every horse in the big spring races, starting with this Saturday's Cox Plate. How I rate them weeks out, and where my ratings are on shakier ground.
 What's newFree Racing Stats for Every Horse, Jockey and TrainerI've opened up free Racing Stats pages for every horse, jockey, trainer and track, with site search and sortable tables. Here's what's in them, using Warwoven as an example.