How to Read a Speed Map: What It Tells You About a Race
A speed map is a prediction of how a race will unfold, not a result. Here's how I read pace, barriers, track bias and weight, and where speed maps fall short.
If you want to know how to read a speed map, start with this: it's a prediction of where each horse will be early in the race, and what that does to how the race finishes. It isn't a result, and it isn't a tip. It's a picture of the likely shape of a race.
I use speed maps every day, but I never use them alone. Here's what they show, what changes them, and where they let you down.
Try it free: open the Speed Map tab for The Everest or the Caulfield Cup in my Demo Playground, and even make your own map. No sign-in needed.
What a speed map actually shows
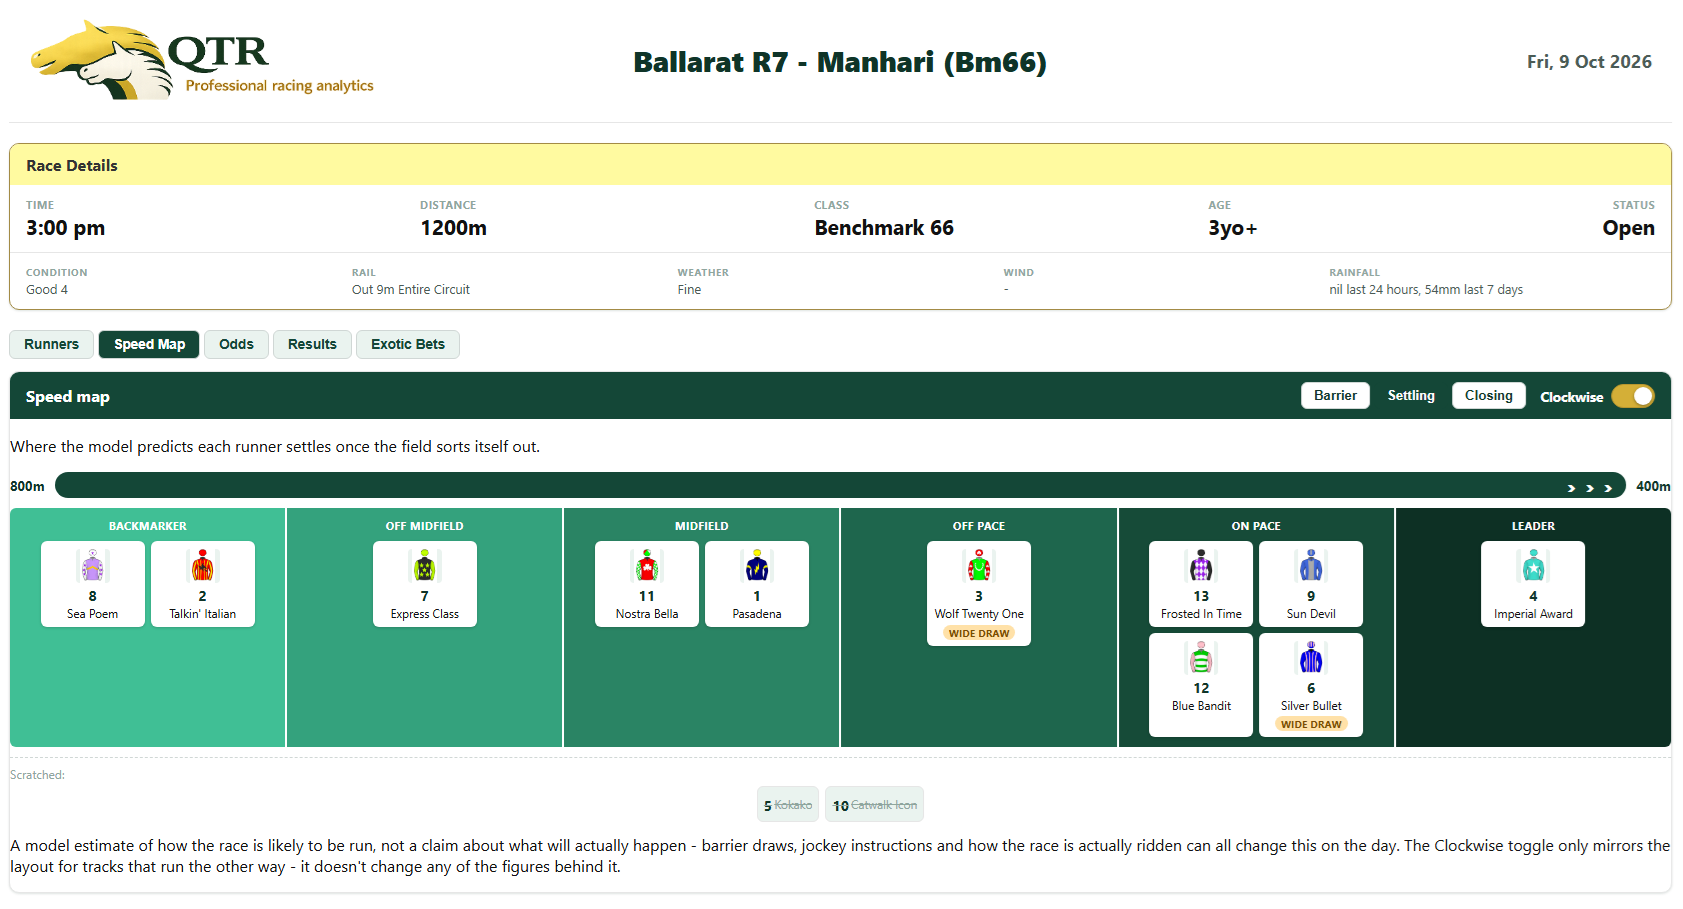
A speed map lines the runners up by where they're likely to be in the first part of the race. It's usually split into rough groups:
- Leaders: horses that want to be in front, or close to it.
- On-pace (or stalkers): horses that sit just behind the speed, often within a length or two.
- Midfield: horses that settle in the middle of the field.
- Backmarkers (or closers): horses that settle near the rear and run on late.
The point isn't to label each horse. It's to see how the groups interact. One lone leader and a tricky wet-track backmarker are very different race shapes from five horses that all want the front.
Why pace matters
A race is a fixed distance, and horses have a limited amount of energy. How fast the early part is run changes who has enough left at the end.
- Hot pace: leaders and on-pace runners spend more energy early. Horses coming from behind often get the benefit late.
- Soft pace: the leader gets an easy time and can sprint home from the front. Backmarkers have too much to do, because the field doesn't come back to them.
- Genuine pace: somewhere in between, which usually rewards the better horse.
This is why a speed map can matter more than a horse's raw form. The same horse can look very different depending on the race shape it's drawn into.
New to QTR? Sign up free and get 7 days of full access: my ratings, speed maps and race summaries for every race. No card needed.
Sign up freeA worked example (made-up numbers)
This is an example only. The horses and numbers are invented to show the idea.
Imagine a 1200m race with 12 runners. For this example, say a typical race at this class has the first 400m run in about 24 seconds.
- Horse A usually leads. It's in barrier 2.
- Horse B usually leads. It's in barrier 11.
- Horse C usually leads. It's in barrier 6.
- Horse D sits on-pace, from barrier 4.
- Horses E, F and G usually settle at the back. E is in barrier 8.
Three natural leaders means the lead is contested. Horse B has to use early speed to cross from the wide gate, and Horse C won't want to be hung out wide either. In my example, that pushes the first 400m to about 23 seconds, a full second quicker than usual.
If Horse A also carries 5kg more than the others, the hot early pace is a bigger ask for it. Horse E, settling a few lengths off the speed, may get a clear run late as the leaders tire. That doesn't mean E wins. It means the race shape is in its favour.
Now change one thing. Say B and C are scratched. Horse A gets an easy lead and the first 400m might be closer to 25 seconds. The leader is fresh at the top of the straight and the backmarkers face a hard task. Same horses, same distance, a very different race.
Barriers change the map
A horse's natural pattern is only half the story. The barrier draw decides how hard it has to work to get there.
- Inside barriers let a leader get across cheaply. A horse that wants to lead from a good gate usually gets its chance.
- Wide barriers can cost a leader energy early, or force it to settle further back than it'd like.
- Short runs to the first turn make the first few strides more important. Barrier draw matters more in these races.
- Big fields mean more horses competing for the same position, so the draw matters more.
- Sprints vs staying races: there's less time to recover from a wide draw in a sprint. In a longer race, a horse often has time to find a position.
I always check the barrier against the horse's habits. A backmarker from barrier 1 may get shuffled back anyway. A leader from barrier 14 may not lead at all.
Natural running patterns
Most horses have a preferred way of racing, and the best speed maps are built on this. I look at the last handful of runs, and I'm checking for:
- Consistency: has it led or sat on-pace in most starts, or does it change?
- Change of tactics: a new jockey, gear change or distance change can alter a horse's pattern.
- First-up or fitness: a horse coming back from a spell may not show its usual speed.
- Where it was drawn last time: a horse that led from barrier 1 may not lead from barrier 12.
A horse that's led once from a good gate is not necessarily a leader. I'd rather see a pattern than a single run.
Early speed vs late speed
Early speed and ability are not the same thing. A horse that begins quickly isn't necessarily good, and a horse that settles last isn't necessarily slow.
What I'm weighing up is how a horse gets its best finish. Some are at their best when they can relax and run on. Others need to be handy to be competitive. A speed map shows the likely position. It doesn't show how well a horse finishes from there. That's why I read it alongside my ratings and not instead of them.
Weight
Weight interacts with pace in a way that's easy to overlook. A leader carrying plenty of weight in a contested lead is under more pressure than a leader carrying light weight in a soft one.
I don't treat weight as a stand-alone rule. A top-weight with a big class edge can still lead and win. But when weight is high, early pressure is heavy and the distance is testing, I'm more cautious about the horse that's likely to be doing the work.
Track bias and conditions
A speed map is a prediction from before the race. The track on the day can change it.
- Rail position: the rail can be moved out, which changes where the best ground is.
- Track condition: a wet track can favour a different part of the track, and sometimes a different running style.
- Bias on the day: if the first few races on the card were won from the front, or from wide out, that's worth noting before the later races.
- Track shape: tight turning tracks and long straights tend to reward different things.
I treat bias as something to confirm during the day, not something to assume. One race isn't a trend. Several in a row start to be.
Not everyone relies on speed maps
Speed maps are useful, but not every punter uses them, and plenty of good punters don't. Some build their approach on ratings. Some lean on sectional times. Some follow stable form, trials or the market. Some just look for value against the price.
I see speed maps as one lens. They're strong in races with a clear pace shape, and weaker in races where nobody wants to lead, or the field is small and the runners are well matched. They don't predict luck in running, either. A horse can be well placed on the map and still get stuck behind a wall of horses.
How I use speed maps at QTR
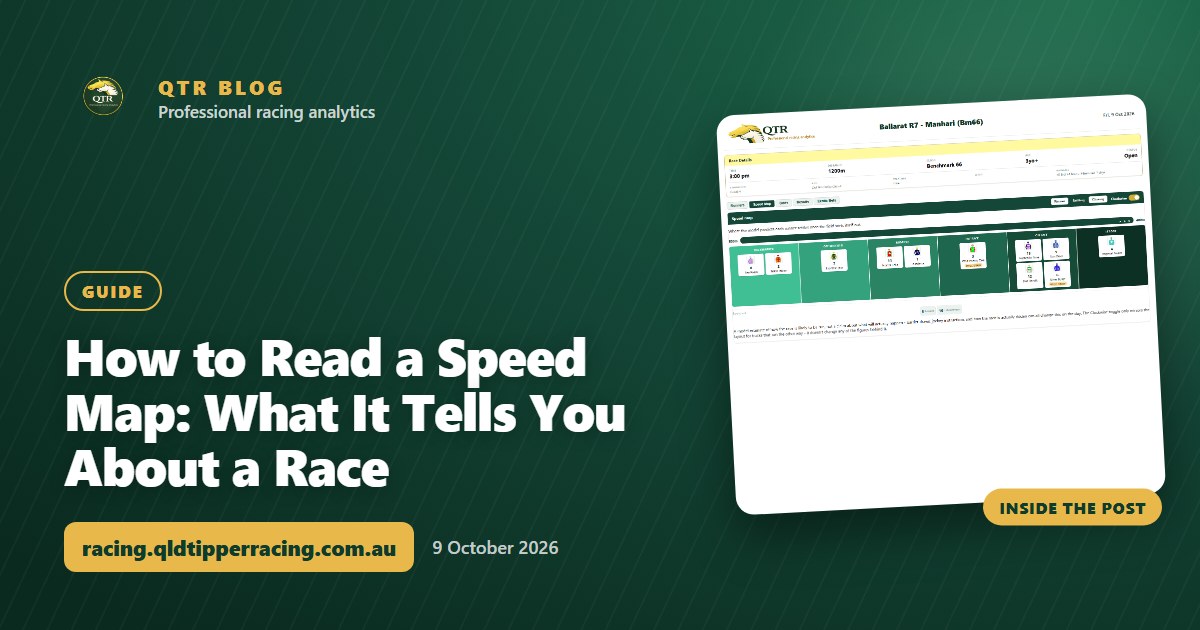
On QTR, there's a visual speed map on the race page, so you can see the likely shape of the race next to the runners, rather than working it out from form alone. The race card column headers also have hover explanations, which helps if you're new to the terms.
To get the full picture, I'd read the speed map alongside a few other things:
- Race summaries and meeting overviews that give a quick read on each race and the day.
- Market movement and live price movement on the race page, to see if the market agrees with the shape.
- Odds comparison, which now includes Bet365, so you can see where the best price sits.
- Summaries in the Meeting Preview PDF, if you prefer to read ahead on paper or on your phone.
You can see what's included at each level on the membership page, and what's changed recently in the changelog. If you'd like more reading first, there are more guides on the blog.
Want to practise first? In my Demo Playground you can set up the speed map for a big race the way you see it, then reveal how the race was run. No sign-in needed.
Ready to try it?
The best way to learn a speed map is to use one. Open a race, look at the shape, then watch how the race plays out. After a few meetings, you'll start to see the patterns.
You can start your 7-day free trial and see the speed map on the race page for yourself.
Frequently asked questions
What is a speed map in horse racing?
A speed map is a prediction of where each runner will be early in a race, usually grouped as leaders, on-pace, midfield and backmarkers. It shows the likely race shape and how much pressure the pace will put on the field.
Does a speed map tell me who will win?
No. It shows the likely shape of the race, not the result. A horse can be well placed on the map and still be beaten by a better horse, or by bad luck in running.
Do barriers matter on a speed map?
Yes. The barrier decides how easily a horse can get to its preferred position. A natural leader drawn wide may have to work early or settle further back, which can change the whole race shape.
Is a hot pace good for backmarkers?
Often it is, because the leaders and on-pace runners spend more energy early and may tire late. It isn't a guarantee, as the closer still needs a clear run and enough ability.
Do all punters use speed maps?
No. Some rely on ratings, sectional times, stable form, trials or the market, and some look purely for value against the price. A speed map is one tool among several.
Get 7 days of full access, free
Sign up free and every feature is unlocked for your first 7 days. No card needed.
- My ratings, speed maps and race summaries for every race
- Ratings Lab, My Assessment and custom speed maps
- QTR Futures for the big races ahead
- Form tools, head to head, trainer patterns and the Statistics tab
Read next
 GuideEnjoy the Punt, Stay in Control: A Plain-English Guide to Responsible GamblingMost people enjoy a punt. Here's what staying in control actually looks like, the tools already there for you, and the free help available any time.
 GuideReading Your Bankroll Statement: A Week in a Punter's BankOne made-up week of 2% staking across two bookmakers, followed line by line: how the stake moves after each race, bonus bets, withdrawals and when to change your percentage.
 GuideTurning Bonus Bets into Cash: Matched Betting with Betfair ExplainedHow matched betting locks in most of a bonus bet's value whatever the result: a $50 bonus bet to about $40 cash, the lay formula, why price matters and what can go wrong.