My Assessment: Rate Every Runner Yourself and Track How You Go
Put your own figure on every runner in a race, compare it with my ratings, and track how your assessments go over time on your Blackbook page.
The best form students I know don't just pick a winner. They go through the whole field and put a number on every runner: how likely they really think it is to win. It's the habit that makes you look at every horse properly, and it's the best way to find out over time whether your own form study is any good.
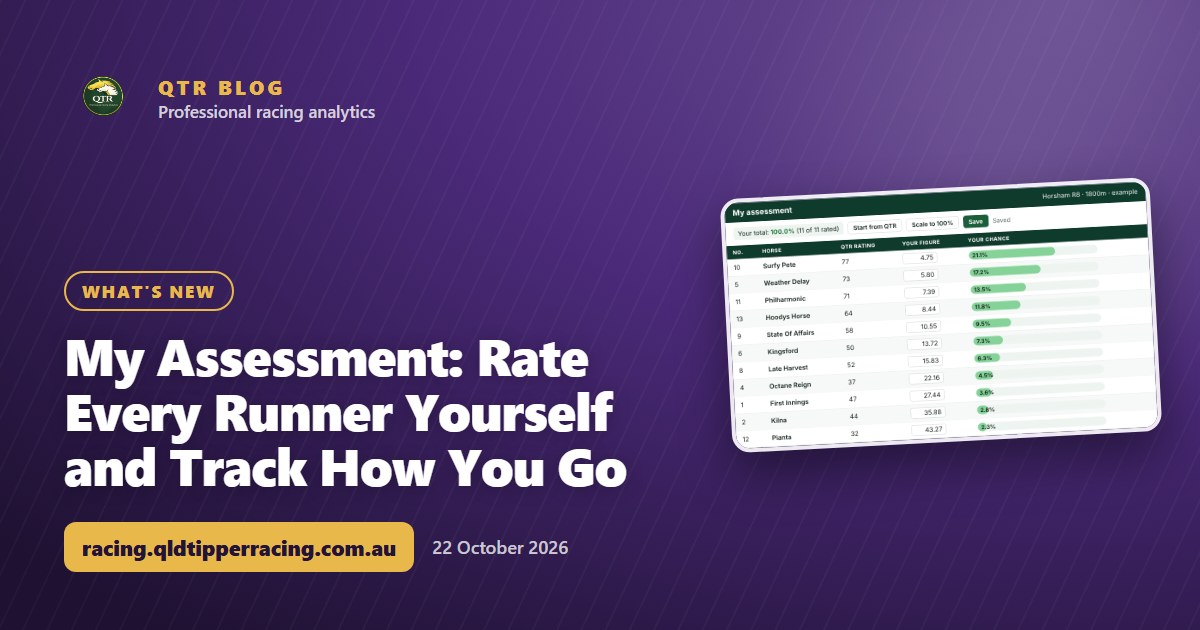
So I've added My Assessment, a new tab on every race page where you can do exactly that, keep it saved to your account, and see how your assessments go.
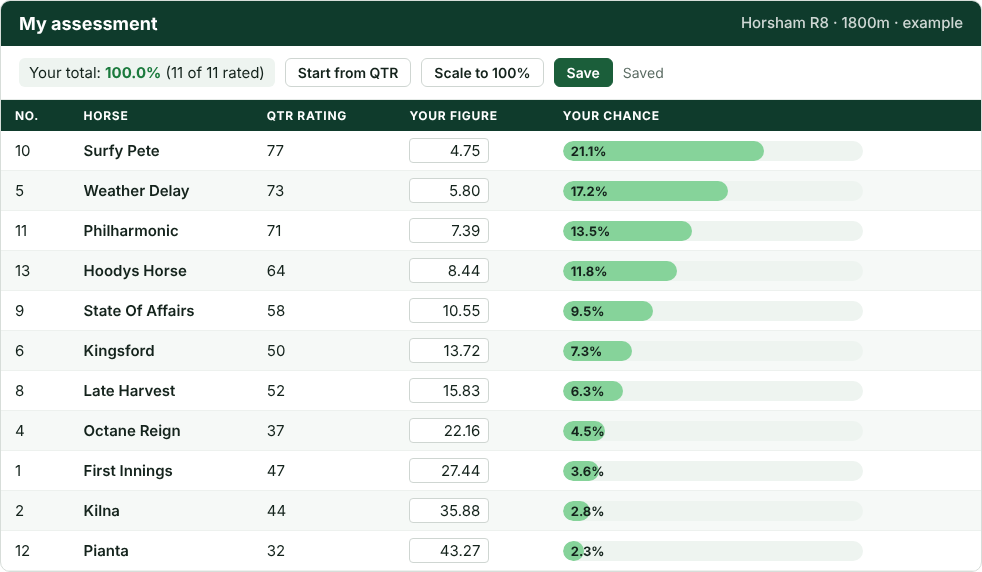
Try it free: rate the Golden Slipper field yourself in my Demo Playground, then reveal the result to see how your top pick went. No sign-in needed.
How My Assessment works
- Open a race and choose the My Assessment tab.
- Type your figure for each runner. A figure of 4.00 means you give it a 1 in 4 chance (25%), 10.00 means 10%, and so on. Leave a runner blank if you don't want to rate it.
- Or start from mine. Tap Start from QTR to fill any empty runners with my figures, then change the ones you disagree with.
- Check your total. Your figures across the field should add up to about 100%. Scale to keeps your order and adjusts every figure so the total comes out at the percentage you choose: 100% by default, or a little higher, like 105% or 110%, if you want your figures on the same footing as the ones you're comparing them with.
- Save. Your assessment is kept on your account, so it's there when you come back to the race.
Scratched runners are struck out and left out of your total, and once the race is run a Result column shows where each runner finished.
What the figures mean
| Your figure | Chance of winning |
|---|---|
| 2.00 | 50% |
| 3.00 | 33% |
| 4.00 | 25% |
| 5.00 | 20% |
| 10.00 | 10% |
| 20.00 | 5% |
If your total is well over 100%, you're rating too many runners too highly. If it's well under, you've been too harsh on the field. Getting it close to 100% is what makes your figures mean something.
New to QTR? Sign up free and get 7 days of full access: my ratings, speed maps and race summaries for every race. No card needed.
Sign up freeCompare your view with mine
My QTR rating sits next to your figure for every runner, so you can see straight away where you agree with me and where you don't. Where you differ most is where your own form study is telling you something my ratings aren't, so those are the runners to look at twice.
The tab also flags, in green, the runners whose current figure is at least 10% longer than yours. Those are the horses you rate more highly than the rest of the field does right now.
Track how your assessments go
Every race you assess is listed in a new My Assessments section on your Blackbook page. For each race it shows:
- your top-rated runner and where it finished;
- the runners you rated more highly than the current figures, and how they went;
- a running total of how often your top-rated runner wins.
After a few weeks, that tells you a lot about your own form study: the race types you read well, and the ones you might leave alone.
Who can use My Assessment?
My Assessment is for QTR members, including anyone on the free 7-day trial. It works on any race, and pairs well with Ratings Lab, where you can tune my ratings to the conditions before you put your own figures down. See what's included on the Unlock QTR page, and everything I've added lately in the changelog.
Not a member yet? Try My Assessment in my Demo Playground on a big race like the Golden Slipper, then reveal the result. No sign-in needed.
However you rate the race, set yourself a budget first and stick to it.
18+ | Gamble responsibly | Gambling Help 1800 858 858 | gamblinghelponline.org.au | BetStop
Frequently asked questions
What figure should I enter for each runner?
Your own view of its chance of winning, written as a figure: 4.00 means a 1 in 4 chance (25%), 10.00 means 10%. Leave a runner blank if you don't want to rate it.
What does Scale to 100% do?
It keeps your order and adjusts every figure so your chances across the field add up to 100%.
Where can I see my past assessments?
On your Blackbook page, in the My Assessments section. It lists each race with your top-rated runner and where it finished.
Who can use My Assessment?
QTR members, including anyone on the free 7-day trial for new accounts.
Get 7 days of full access, free
Sign up free and every feature is unlocked for your first 7 days. No card needed.
- My ratings, speed maps and race summaries for every race
- Ratings Lab, My Assessment and custom speed maps
- QTR Futures for the big races ahead
- Form tools, head to head, trainer patterns and the Statistics tab
Read next
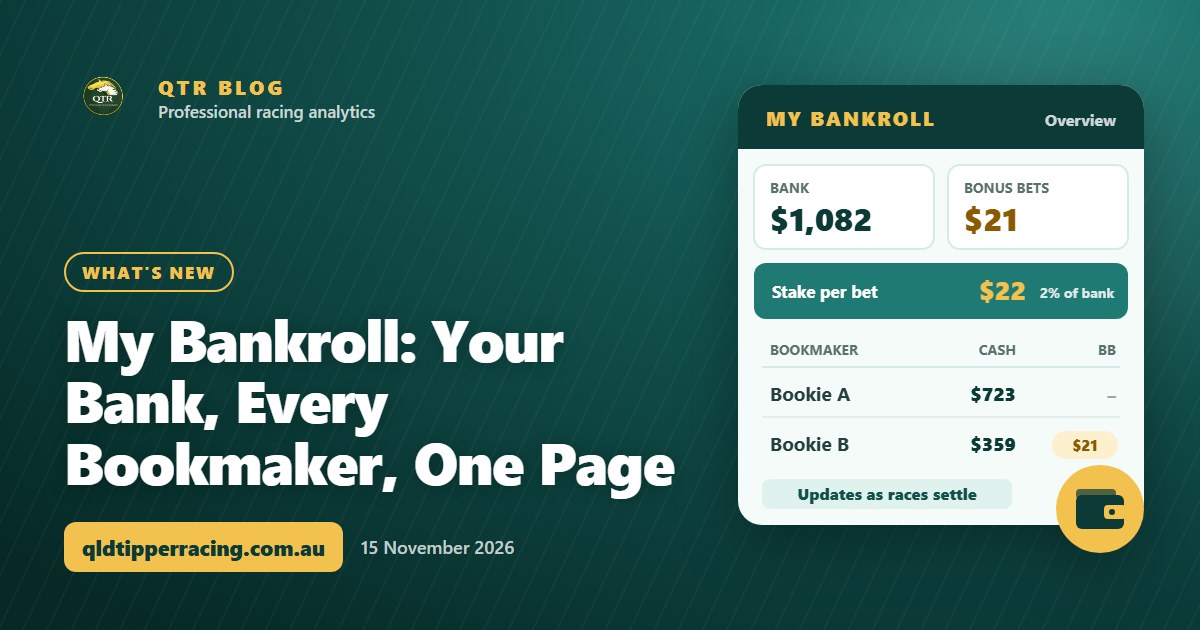 What's newMy Bankroll: Your Bank, Every Bookmaker, One PageMy Bankroll keeps your whole bank in one place across every bookmaker, works out your stake for each race and updates itself as your bets settle.
 What's newQTR Is Now an App: Install It and Choose Your NotificationsQTR now installs on your phone straight from the website - free, no app store. Here's how to add it on Android or iPhone, and how to choose your notifications.
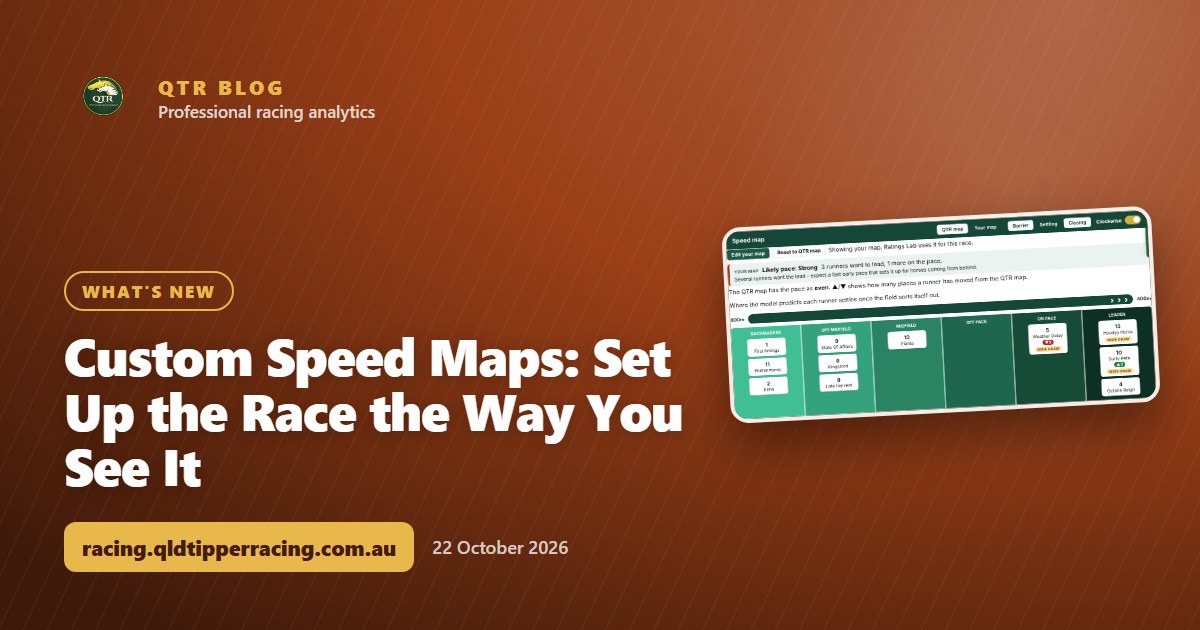 What's newCustom Speed Maps: Set Up the Race the Way You See ItThink a runner will go forward or get back? Move it on the speed map, watch the likely pace change, and save your own map for the race.